
Yield vs Bid-to-Cover: What the Uganda 91-Day Auction History Tells Us

TL;DR: Bid-to-cover ratios remain healthy, meaning the market is showing up; But yields are still rising, signaling that investors want more compensation for risk. This reflects growing concern over reinvestment risk, fiscal uncertainty, and political volatility heading into 2026. However, auction results alone aren’t enough, you must layer in macro trends like inflation, policy rates, and global market signals. Bottom line for Uganda, Liquidity hasn’t dried up, but confidence is cautious. Investors are buying, but at a price.
Context
Understanding what drives Uganda’s Treasury bill yields is essential for investors, traders, and policymakers. One of the most telling indicators is the bid-to-cover ratio, the total bids received divided by the amount offered, which reveals the level of demand for government securities.
Why It Matters
Research shows that higher bid-to-cover ratios lead to lower yields, signaling strong demand for government securities. This has been observed in U.S. Treasury auctions, The ECB (2017) confirmed the same pattern across Eurozone debt markets and Smales (2019) found that higher bid-to-cover ratios also reduce post-auction volatility.
These findings apply beyond developed markets, including Uganda, where auctions often serve as real-time barometers of economic sentiment.
The relationship between Treasury bill yields and the bid-to-cover ratio provides a window into market psychology, capturing how investors assess risk and opportunity in short-term debt.
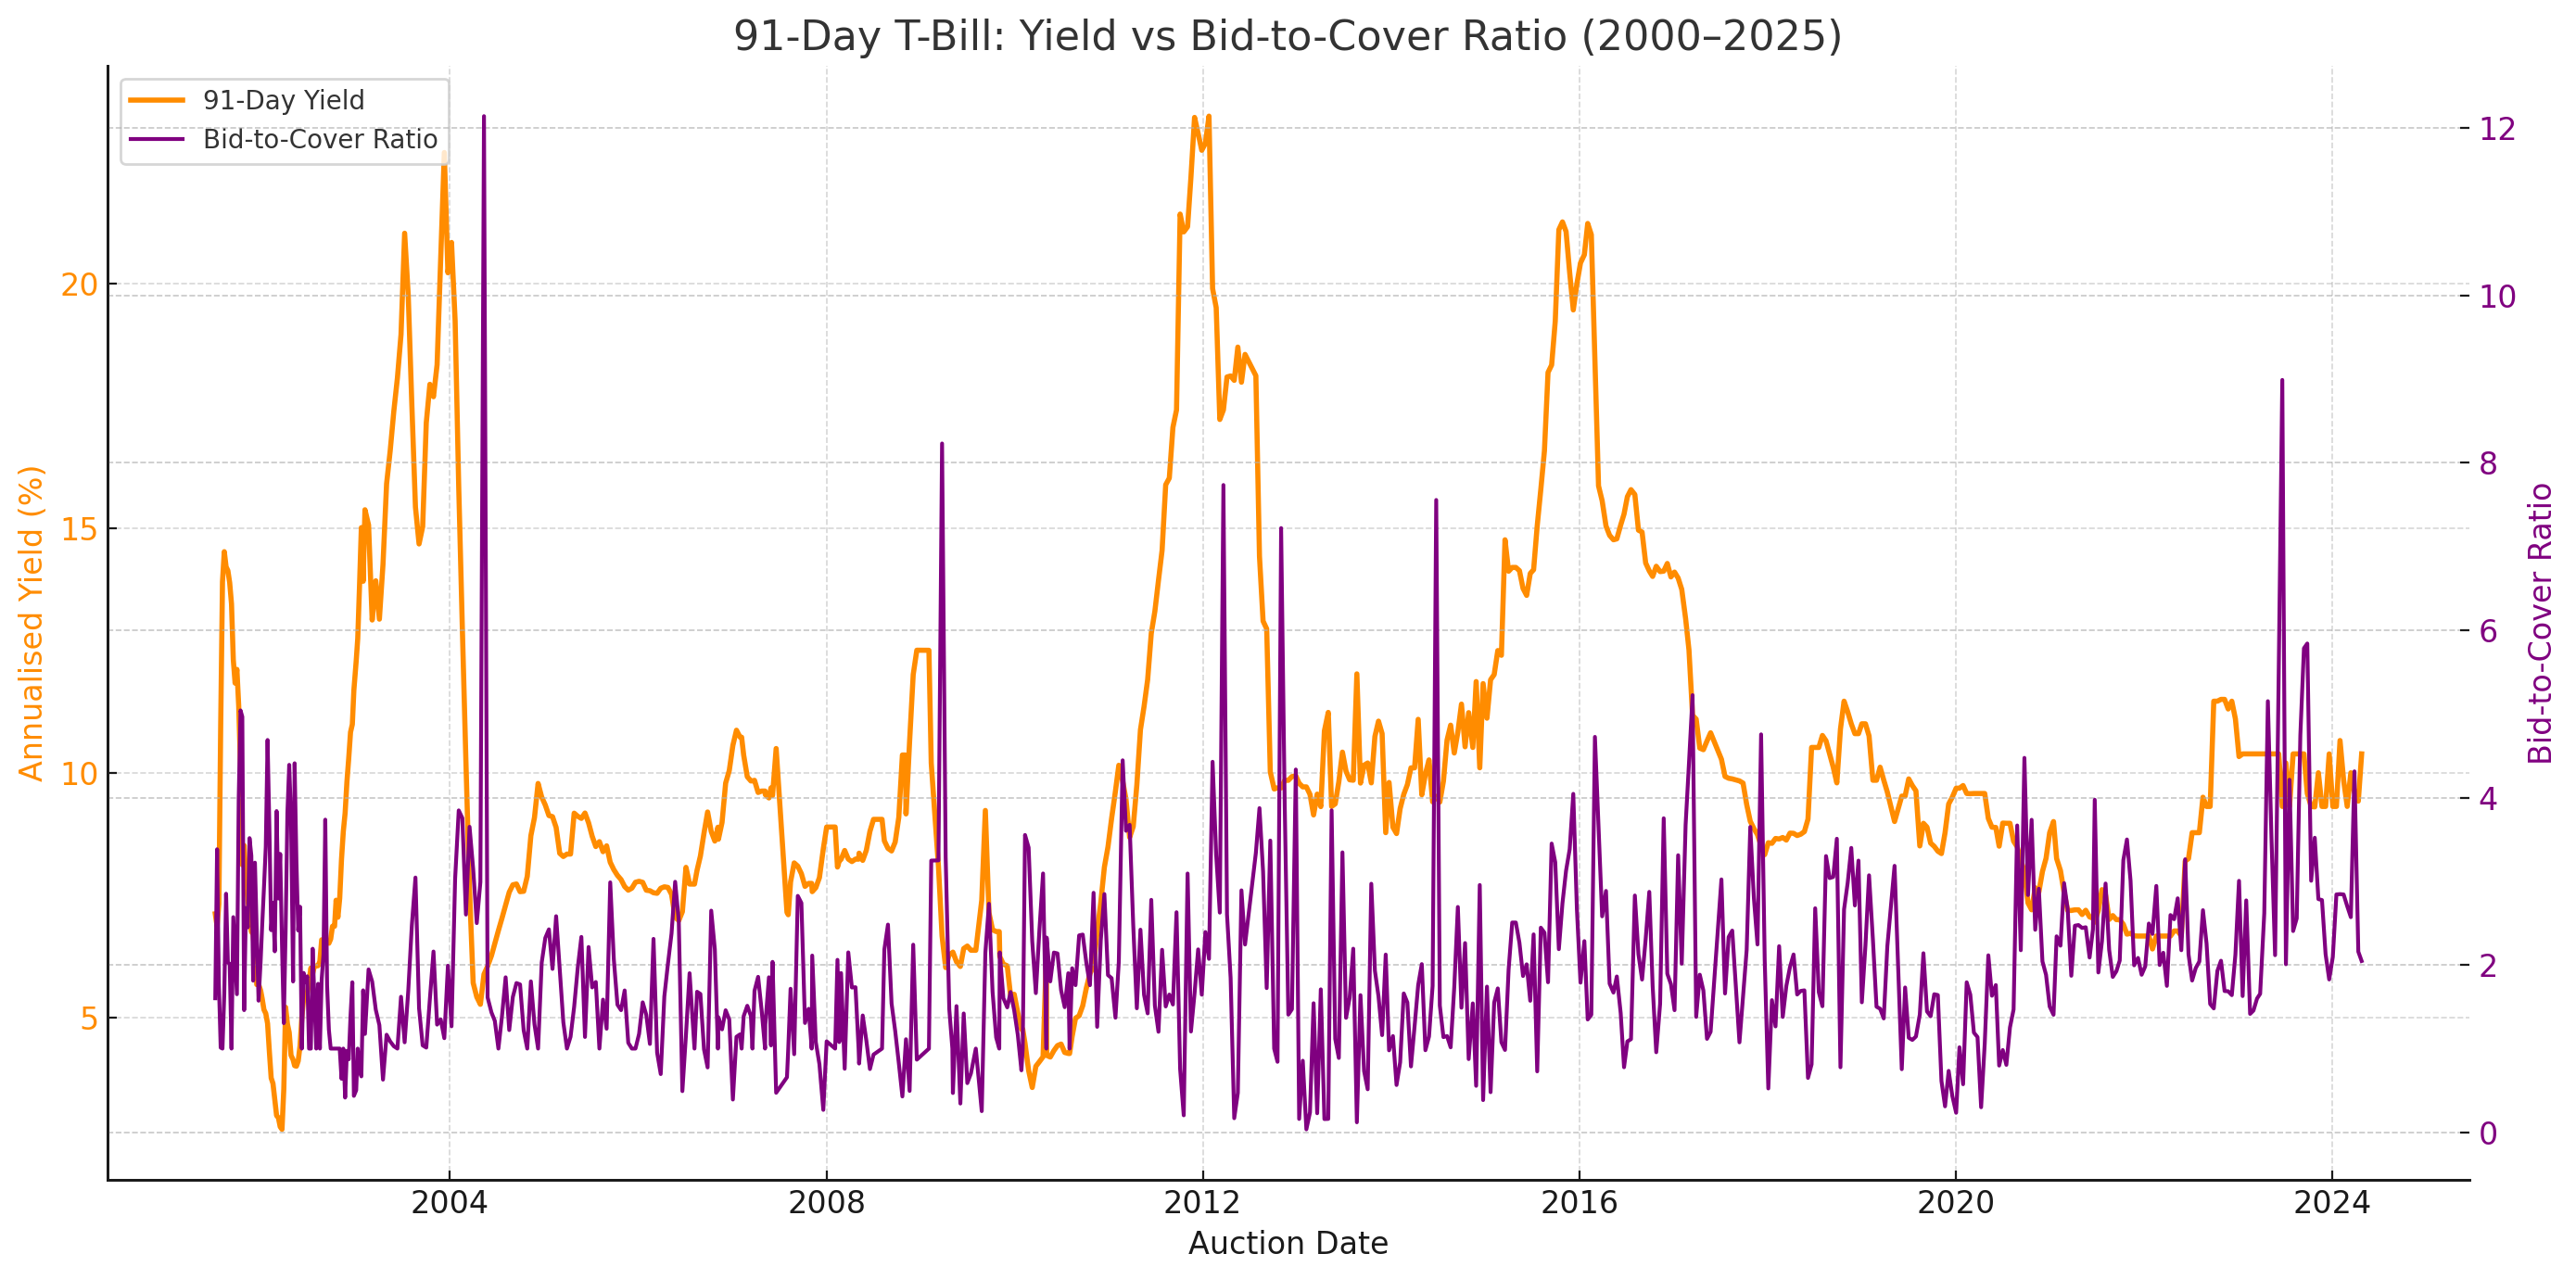
Uganda’s 91-Day T-Bill: Yield vs Bid-to-Cover, 2000–2025
To explore this dynamic locally, we’ve charted the historical relationship between the 91-day T-bill yield and its bid-to-cover ratio from FY2000/01 through FY2024/25.
Key Insights from the Data:
1. Inverse Relationship Holds, But Not Always
Traditionally, a higher bid-to-cover ratio (🟣 purple line) suggests strong demand and lower yields (🟠 orange line), as investors are willing to accept less return for the perceived safety of T-bills. This pattern is evident in:
2006–2009 and 2017–2019, when high confidence and liquidity drove both strong bidding and low yields.
However, during stress periods (e.g. 2011, 2020, and late 2023), we observe:
Rising yields despite solid demand, suggesting that investors were still willing to participate but demanded compensation for heightened risk (e.g. inflation, fiscal concerns, donor delays).
2. Post-2023 Divergence: Risk Premiums Are Rising
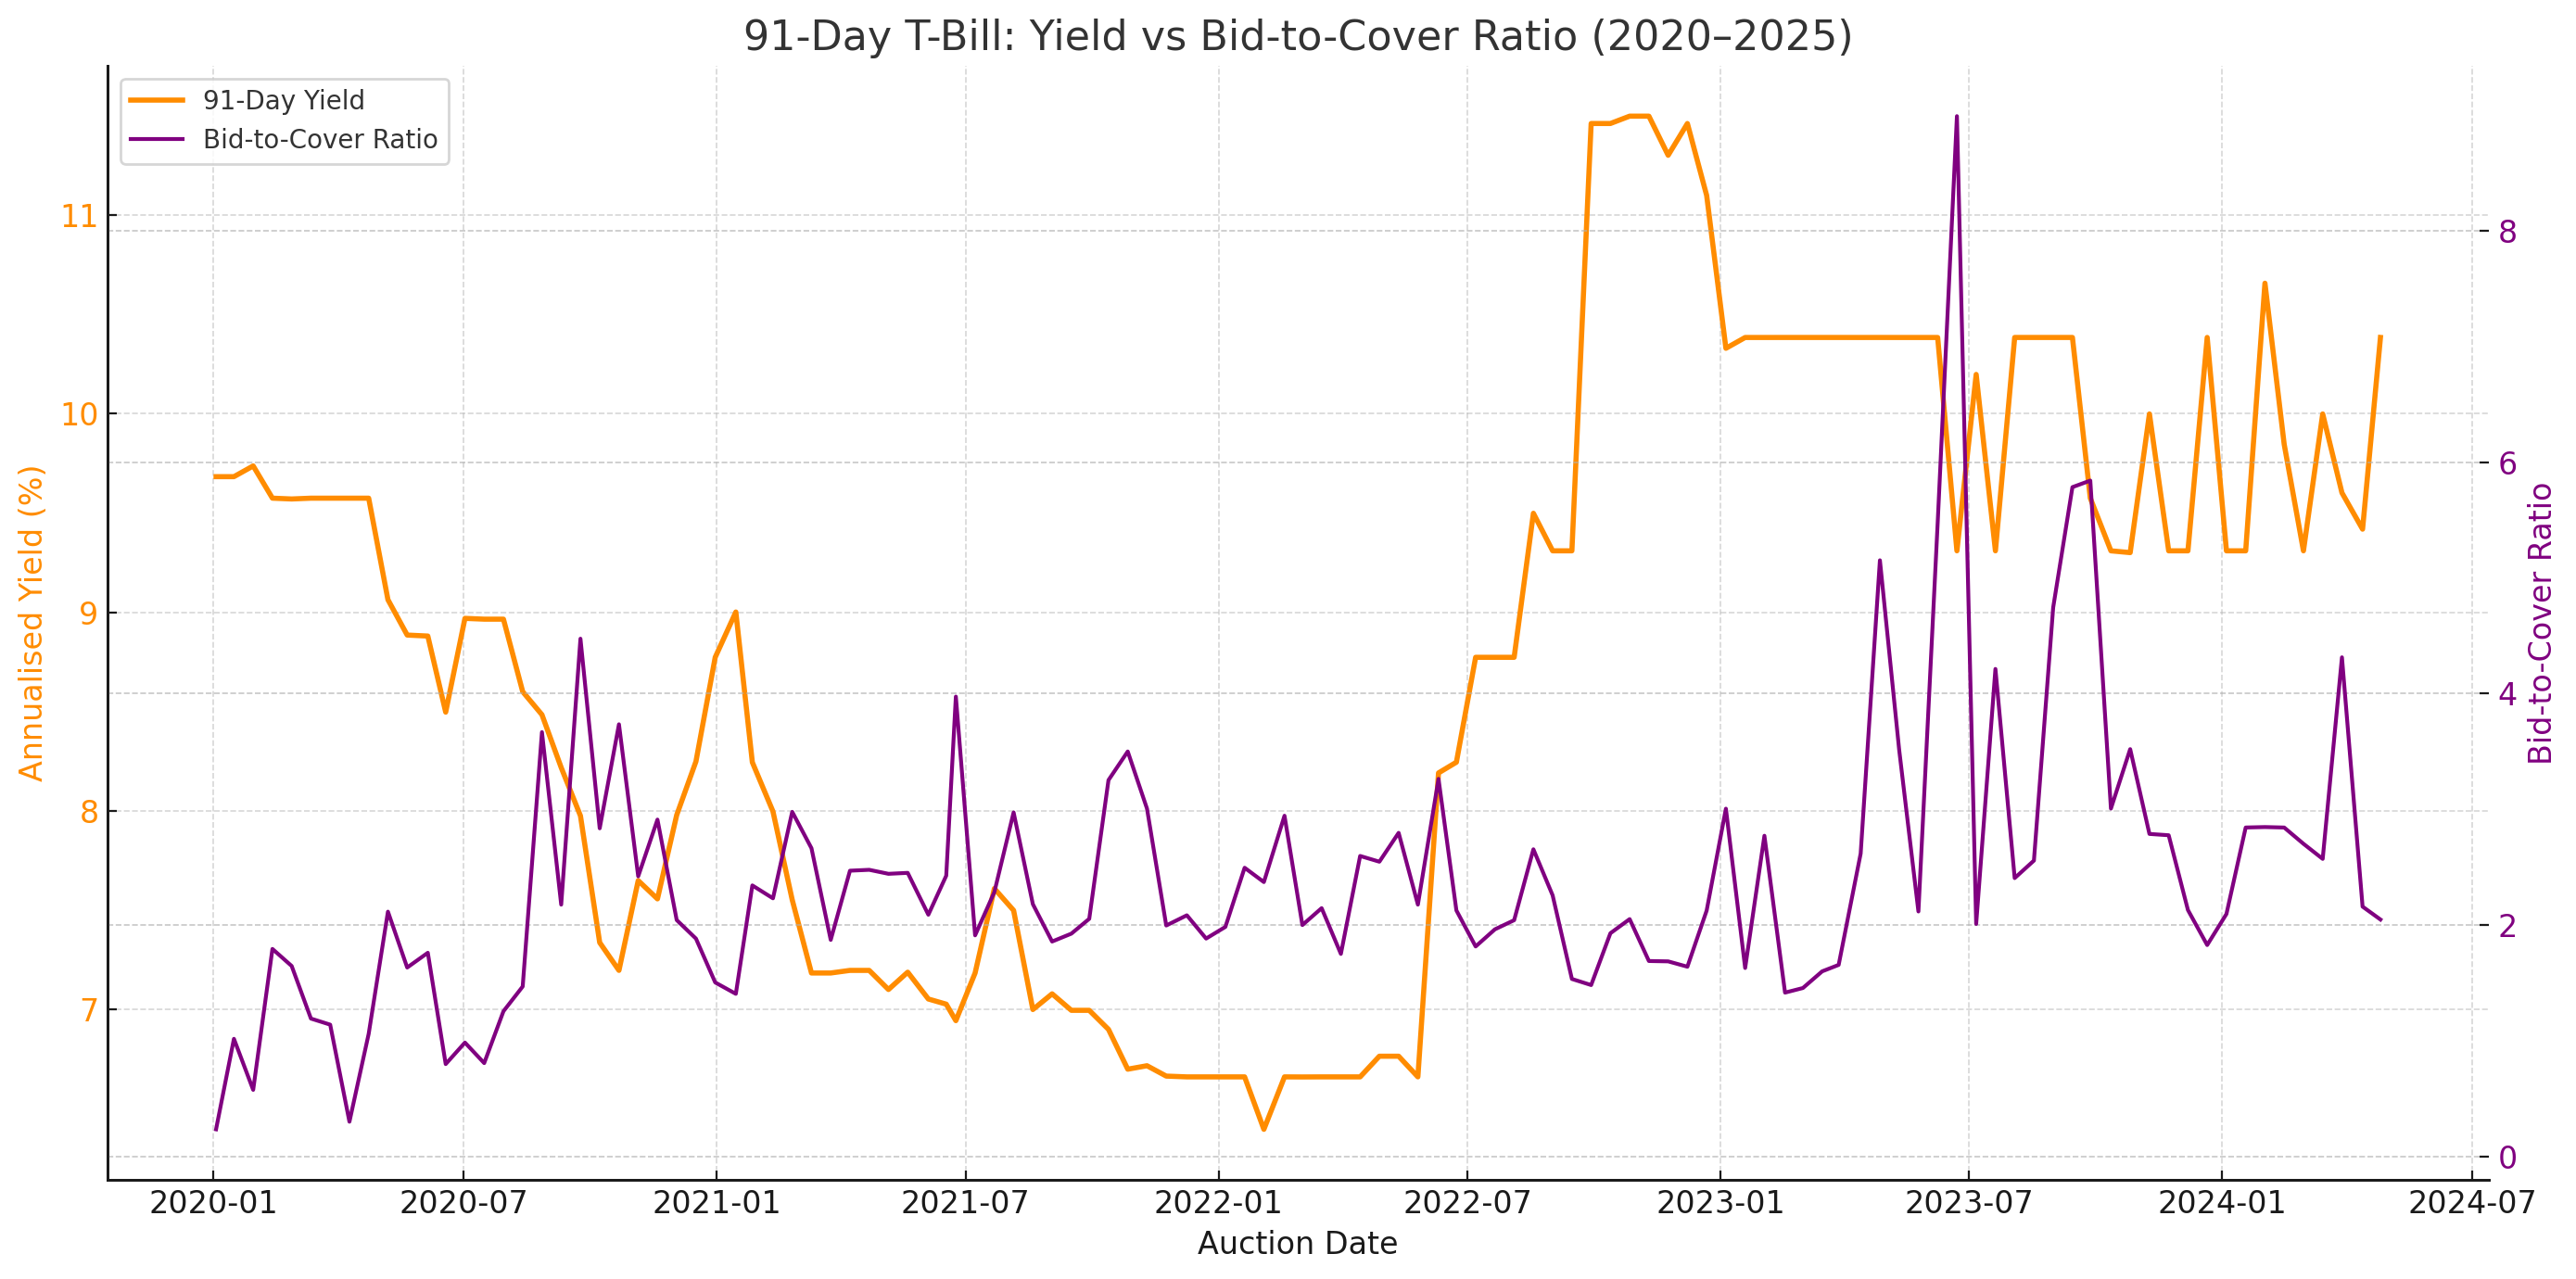
From late 2023 into 2025, a notable divergence appears:
Yields climb, while the bid-to-cover ratio remains elevated or volatile.
This signals a market with liquidity, but one that is pricing in reinvestment risk, uncertainty over fiscal operations, and potential political volatility heading into 2026.
3. Macroeconomic Fundamentals
While this analysis has focused on auction analytics, particularly the bid-to-cover ratio, it's only half the story. To truly understand and forecast short-term yield movements and embedded risk premiums, we must overlay auction data with macroeconomic fundamentals and market context, including: 1) monetary policy as the anchor; 2) inflation and growth expectations; 3) treasury supply volume and fiscal pressure (donor flows, government spending); and 4) global financial conditions and liquidity premiums - such as U.S. yields, elections or commodity shocks.
Auction results are market signals, but macro context tells you why the market is reacting that way.
What It Means for Traders and Policymakers
For traders, treasury auctions aren’t just about winning bids, they are early signals of shifting sentiment, reinvestment risk, and curve dynamics. For example, a falling bid-to-cover with rising yields may indicate market rejection and price discovery ahead.
For policymakers, weak bid-to-cover ratios and rising yields, even with steady policy rates, reveal growing market caution, often driven by fiscal uncertainty, delayed inflows, or liquidity strain. For example, High bid-to-cover with still-rising yields suggests that T-bills remain attractive, but policy signals must be clear to contain risk premiums.
Bottom line: Auction results tell us more than who bought what. They reflect investor trust, pricing power, and policy credibility in real time. As Uganda heads into a critical second half of FY2025/26, keeping a close eye on auction trends + macro context will be key to staying ahead of market shifts.
Takeaway:
Uganda’s Treasury market is not retreating, it is repricing. The consistent participation in auctions shows liquidity remains. But rising yields, even amid healthy demand, reveal a growing risk premium.
As Uganda starts another financial year FY2025/26, watching how auction outcomes and macro signals interact will be essential for staying ahead of rate shifts, refinancing risks and investor behavior.
🚀 Not yet a subscriber? Join Impala Market Premium for aggregated data and analytics, weekly strategy, positioning maps, and alpha signals.
Want to invest in Africa’s bond markets? Impala Market helps you track opportunities, compare bond yields, and connect with buyers & sellers in the Over the Counter (OTC) market.
Get real-time bond market insights, track upcoming auctions, and access the secondary (OTC) market to trade bonds effortlessly.
Weekly insights on bond market developments, macro drivers & investment opportunities
Tailored for individual investors, investment clubs, institutional investors, traders & offshore investors
Subscribe for updates on Impala Market
Disclaimer: Impala Market is a private information-sharing platform for licensed institutions. It is not a licensed securities exchange or trading platform. Indicative prices shared are not offers to the public.