
BoU Steepened the Curve. The Market Didn’t See It Coming. Neither Did We.
By Impala Market | Post-Auction Analysis | April 15–23, 2026

The Bank of Uganda did not just suppress yields on April 15th. It engineered the shape of the entire curve — and the secondary market data from the week that followed tells us exactly how the market absorbed it.
The scorecard first, without spin.
Tenor | Predicted | Range | Actual | Verdict
3-Year | ~15.00% | 14.75–15.25% |13.39% | ❌ Miss — 161bps below range
10-Year | ~14.75% | 14.50–15.25% | 15.50% |❌ Miss — 25bps above range
20-Year | ~15.60% |15.25–16.00% | 16.10% | ❌ Miss — 10bps above range
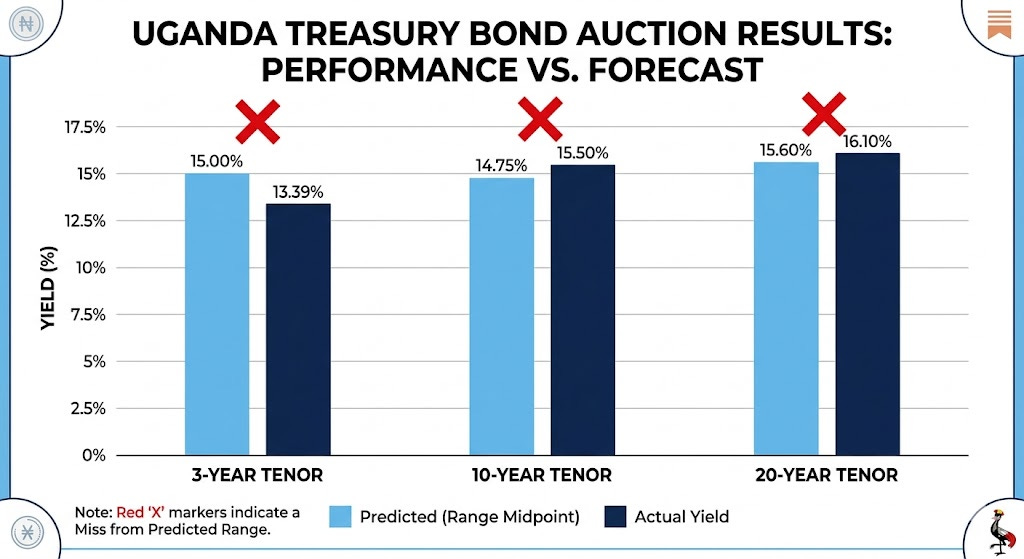
We called the suppression campaign correctly. What we underestimated was how deliberately asymmetric it would be — BoU compressed the front hard, and let the long end breathe.
BoU’s Move: Front Down, Long End Up
The 3-year cleared at 13.39% — 161bps below our range floor. At a cutoff price of 108.174, buyers paid a steep premium for short paper. BoU accepted UGX 331.8bn against UGX 230bn offered, deliberately over-allotting to flood the short end at suppressed yields.
Meanwhile, the 20-year cleared at 16.10% — above our range ceiling — and BoU again over-allotted, absorbing UGX 647.8bn against UGX 430bn offered.
The 10-year landed at exactly 15.50%, clearing at a 110.199 cutoff price with BoU accepting only UGX 54.3bn from UGX 354.8bn tendered — an 85% rejection rate.
The result: a 3-year/20-year spread of 270 basis points on auction day.
BoU is using the yield curve as a tool — compressing short-term rollover costs while locking in long-duration financing before conditions change.
For a government facing UGX 6.6 trillion in rollover obligations this fiscal year, anchoring the front of the curve at 13% while clearing the back at 16% is exactly the right trade to make.
The Week After: What the Secondary Market Confirms
Six days of secondary market data — April 16th through 23rd — add crucial texture to the auction story.
Total secondary market turnover by day:
Date | Total Turnover | Notable
16-Apr | UGX 366.1bn | First post-auction session
17-Apr | UGX 486.7bn | Heavy 10Y and 20Y activity
20-Apr | UGX 96.4bn | Monday — thin, holiday effect
21-Apr | UGX 527.6bn | Surge — institutional repositioning
22-Apr | UGX 126.3bn | Midweek pause
23-Apr | UGX 580.4bn | Week’s highest volume
The alternating pattern — heavy Tuesday/Thursday, thin Monday/Wednesday — is consistent with institutional settlement cycles. The surge to UGX 580.4bn on April 23rd, the highest volume day of the week, signals sustained demand rather than a post-auction relief rally.
The 20-Year: The Market Immediately Repriced Below Auction
This is the most important data point for investors who missed April 15th.
The 20-year bond cleared the primary auction at 16.098%. By the very next morning — April 16th — the secondary market median yield had already fallen to 15.91%. By April 23rd, it had settled at 15.85%.
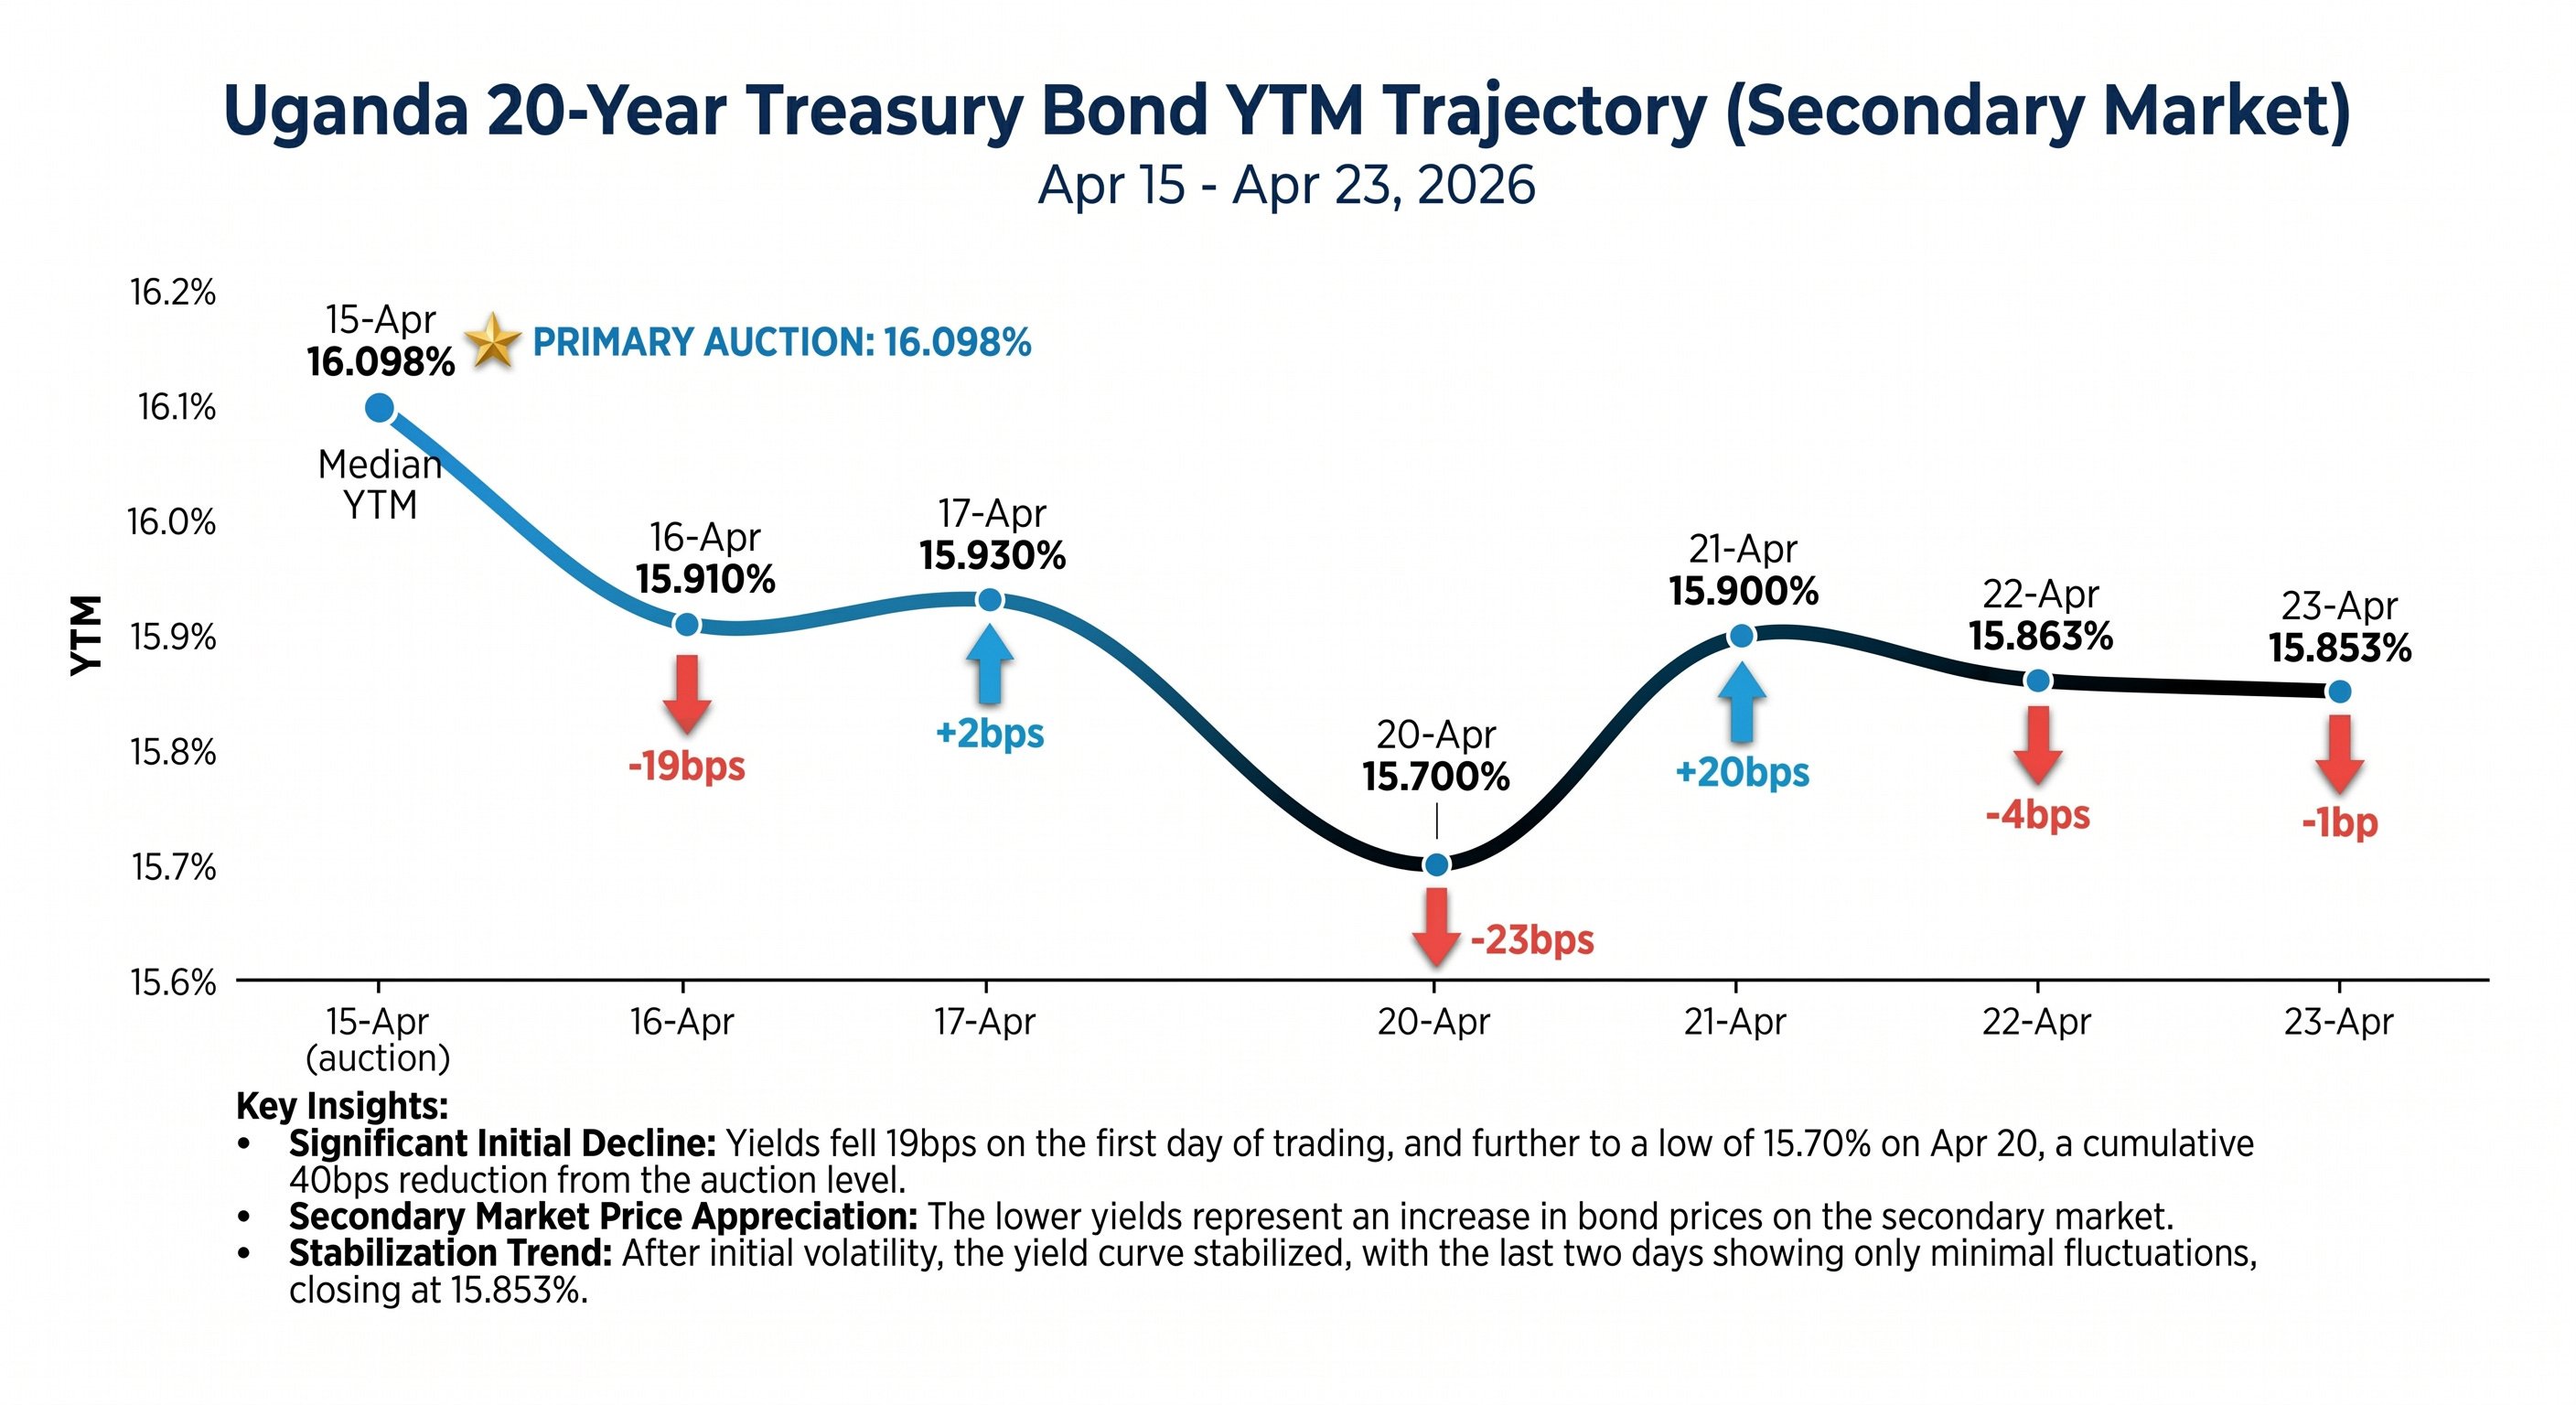
Two things stand out. First, the 20-year’s secondary market yield fell immediately below the primary auction clearing yield — meaning investors who bought at 16.098% on April 15th were sitting on a capital gain by the following morning.
Second, the bond has stabilised in a tight corridor of 15.75%–15.95% across the week, with the daily yield range narrowing as the market finds a new equilibrium.
The 20-year is trading at a 25–30bps premium to its auction clearing yield just one week later. Primary market buyers got in at the best yield available.
The 38 individual 20-year trades recorded on April 23rd alone — the most active single bond on the busiest day of the week — confirm this is the most liquid long-dated instrument on the Uganda curve right now.
The 10-Year: Drifting Below Auction, With Volume to Prove It
The 10-year tells a different and more interesting story.
It cleared the primary auction at 15.50%. On April 16th, the secondary market opened at exactly the same level — median 15.50%. But by April 22nd, it had drifted to a median of 15.003%, and April 23rd saw it settle at 15.252%.
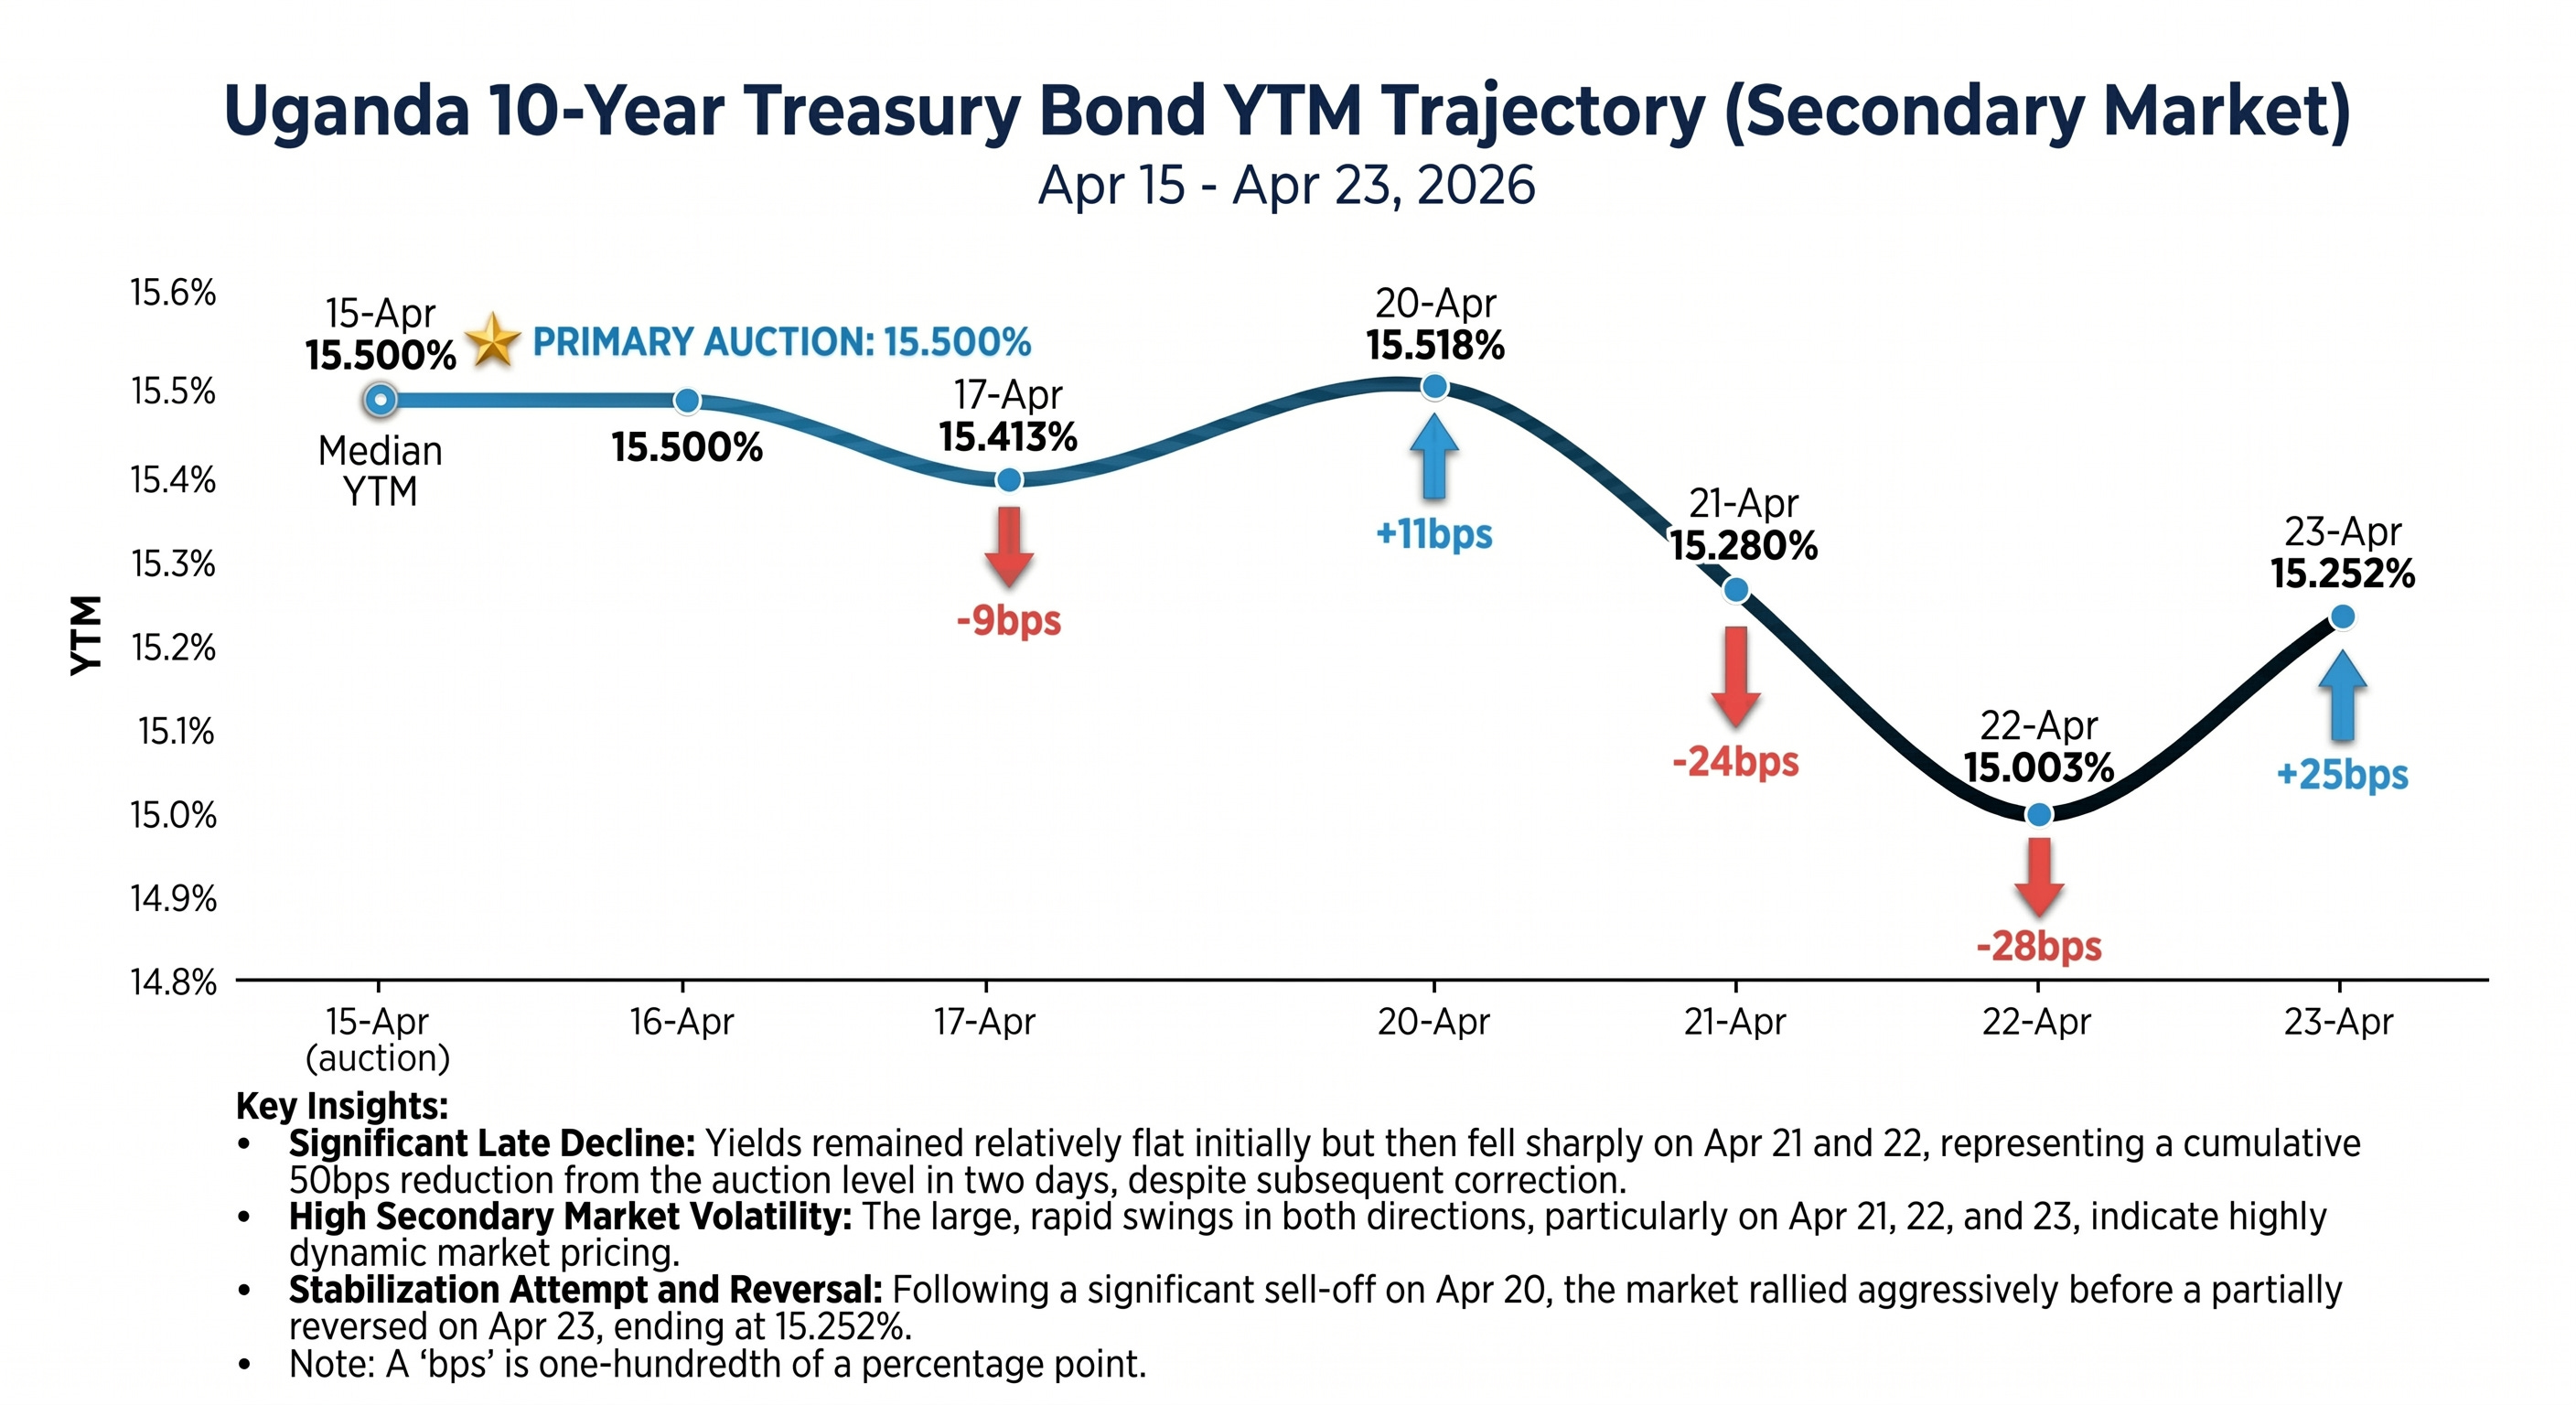
The 10-year is oscillating in a 15.00%–15.55% band, with the trend line pointing slightly lower. The bid-to-cover of 6.535 at the auction — 85% of bids rejected — means there is a large pool of unsatisfied demand still searching for allocation. That overhang is putting gentle downward pressure on yields as participants buy in the secondary market what they could not access in the primary.
With UGX 300bn in unfilled 10-year demand still in the market, secondary yields will likely continue to drift toward 15.00% before the next auction cycle.
The 3-Year: Anchored at 13%, Going Nowhere
The 3-year is the clearest expression of BoU’s front-end policy. Across all six days, secondary market yields traded in a tight band of 13.00%–13.80% — barely moving from the 13.39% auction clearing level. There is no secondary market pressure to reprice the front end higher. BoU has successfully set the anchor.
For investors: this is not where you should be adding new positions. The 3-year at 13–13.5% offers a real yield of roughly 10–11% above inflation — attractive by any absolute standard — but it is 250bps below the 20-year and roughly 200bps below the 10-year. The compensation for tying up capital for three years relative to the alternatives is insufficient.
Volume Tells the Allocation Story
Wednesday April 23rd’s UGX 580.4bn in total secondary market turnover — driven heavily by 20-year (38 trades), 10-year activity, and large T-bill bloc trades — suggests the market absorbed the April 15th auction cleanly and is actively repositioning. The large T-bill transactions (multiple UGX 25–50bn bloc trades in the 13-Jul-26 and 14-Jan-28 paper) confirm that short-end liquidity recycling is running at full pace. Cash from maturing short paper is not sitting idle — it is being redeployed into bonds.
Where You Should Be Positioned Now
3-Year — Hold, don’t add. The 13.00–13.40% corridor is BoU’s floor. It will not move significantly before the next auction. Existing holders should hold to maturity. New buyers should look elsewhere on the curve.
10-Year — The secondary market is giving you a better entry than the primary. The 10-year is now trading at 15.00–15.30% in the secondary market — below the 15.50% primary clearing yield. If you missed April 15th, the secondary market is offering you a more favourable YTM right now. Bid into the market at 15.20–15.40%. The unfilled auction demand overhang is your friend as a buyer.
20-Year — The best primary market trade on the Uganda curve just got confirmed by a week of secondary data. Investors who entered at 16.10% on April 15th saw their position gain value immediately and hold it through the week. The secondary market has settled in the 15.75–15.95% range — meaning the 20-year is now priced at or slightly above par. For new secondary market buyers, the entry window is still open below 16%, though the gap to the April 15th primary yield is narrowing. For the next primary auction: accumulate at anything above 15.75%.
The Analytical Lesson
Our pre-auction framework identified the right dynamic: BoU suppression, primary-secondary gap, selective rejection. The specific numbers missed because we modelled uniform suppression across tenors. What BoU delivered was surgical curve management — front end compressed, back end freed.
The secondary market data confirms the strategy has worked exactly as intended. Short yields are anchored. Long yields are market-clearing. And the week’s heaviest volume sessions — April 21st and 23rd — show the market accepting the new curve shape without distress.
Uganda’s yield curve is no longer a passive reflection of market supply and demand. It is an actively managed policy instrument. Investors who internalise that distinction will navigate it profitably. Those who don’t will keep getting surprised by auction results.
The next auction is the one to watch. If BoU holds the 3-year below 14% and allows the 20-year to clear in the 15.75–16.00% range, the curve steepening is structural and deliberate. That is the most important signal in Uganda’s domestic capital market right now — and Impala Market will be watching every bid.
Impala Market publishes Uganda bond market auction previews, secondary market analysis, and yield curve commentary. Subscribe at blog.impala.market. All data sourced from Bank of Uganda CSD daily reports. This analysis is for informational purposes and does not constitute investment advice.